Creating a Casual Game Progression Curve
Why Do You Need to Model
Inappropriate progression is often seen at a stage of the soft launch. We may observe that a player passes through the game too fast, and content is exhausted after several days of playing. It could be that the player reaches high levels in the first two hours of playing and continues leveling up quickly.
These are consequences of too fast progression, which leads to a surplus of in-game currency, and the player finishes the game too fast. This isn’t nice for the in-app monetization because in-game resources gradually accumulate with progression. It also limits ad monetization because a player stays in the game not as long as possible.
In the opposite situation, when a player passes the level too long, he gets bored or frustrated, leading to a high churn rate.
Appropriate in-game metrics observation and analysis reveal these problems during the soft launch, but statistical simulations allow for fine-tuning progression much earlier on a stage of game design. This will help avoid altogether or reduce progression-based problems and save time during the soft launch.
Below, we will show an example of progression fitting by user’s behavior simulations for a case of a simple trivia game. The article aims to offer a general approach to the progression curve fitting based on simulations that can be undertaken on a stage of the economy design before launch.

Example of Trivia Game Modeling Progression
For example, let’s take the next trivia game:
A game consists of rounds with ten questions; each question has four variants of answers. A player receives an XP reward and passes to the following questions if the answer is correct. They should re-start the round from the 1st question by giving the wrong answer. When answering all questions in a round correctly, a player receives a bonus and a higher XP reward. They also receive rewards when leveling up.
So, two sources are present: the correct answer to the last question and a level up. We have to design a progression through the game to make these two sources occur reasonably often. This task consists of two subtasks:
- Define a number of questions in a round. Should it be 10, or maybe 5, or 20? Then we should find how often a player will complete a round and get a reward.
- We need to fit xp-to-level formula, making level progression faster at the beginning and slower later. Then we could make a rough estimation of how often level-ups will occur.
Fitting Progression 1. Defining The Quantity Of Questions Per Round
Let’s characterize the player’s behavior by the probability of giving a correct answer. Guessing randomly on four variants of the answer, a probability of being correct is 0.25. We expect players to play better than random guessing, at least those who like our game and stay there. If there is a competition with another real player, we may expect the probability of winning to win as 0.5. Such a player most probably will leave our game. But we can take it as a lower-bound estimation. As an upper-bound estimation, we’ll set 0.9, meaning that the player correctly answers nine questions from 10. This means that questions are too easy and should be re-designed. So let’s take players with probabilities of winning as 0.5, 0.6, 0.7, 0.8, and 0.9 to see the broad range of behavior. Here 0.6-0.8 are expected probabilities, and 0.5 and 0.9 – are edge cases.
Let’s a sample from a binomial distribution a sequence of events with lengths 5, 7, 10, and 15, corresponding to the number of questions in a round, and pass winning probabilities as a distribution parameter. Repeat this 1000 times and calculate the average (1) attempt at which a player reaches the last question and (2) length of the round.
| attempts to reach the last q-n | length of round | ||||
| win proba | # of questions | mean | median | mean | median |
| 5 | 0.9 0.8 0.7 0.6 0.5 | 14 11 14 19 33 | 8 10 10 13 23 | 3.5 2.7 1.9 1.4 1 | 5 2.5 1 1 1 |
| 7 | 0.9 0.8 0.7 0.6 0.5 | 19 19 27 50 122 | 14 13 19 37 87 | 4.8 3.1 2.1 1.4 1 | 6 3 1 1 1 |
| 10 | 0.9 0.8 0.7 0.6 0.5 | 27 36 80 258 1025 | 19 25 59 182 703 | 5.8 3.6 2.2 1.4 1 | 6 3 1 1 1 |
| 15 | 0.9 0.8 0.7 0.6 0.5 | 43 116 481 3191 32475 | 29 84 338 2255 24017 | 6.8 4 2.3 1.5 1 | 6 3 1 1 1 |
| 20 | 0.9 0.8 0.7 0.6 0.5 | 75 369 2920 42610 | 53 260 1918 30506 | 8.2 3.9 2.3 1.5 1.4 | 7 3 1 1 1 |
As seen in Table 1, in the case of 10 questions in a round, a not very good player with winning probabilities of 0.5 – 0.6 needs to make around 200 or more attempts to reach the last question and get a bonus. In a case of 5 questions, a relatively good player with winning probabilities of 0.8-0.9 is reaching the last question in around ten attempts, which looks too often. Approximately seven questions per round look more reasonable but a bit fast too. In cases of 7 and 10 questions per round, an average length of a round is 1-3 questions for probabilities 0.6 – 0.8.
A good choice will be to take 9 or 8 questions per round and quickly design the first one or two questions. Then a player will reach the last question in about 30-60 attempts, while the average duration of a round would be 2 – 4 (or 3 – 6) questions per round. Later, if deciding to limit the number of sessions per day or balancing currencies, we should consider these values.
Fitting progression 2: XP vs Played Rounds
The second step is to design an XP-to-level formula. If we plan rewards on level up, we should estimate how often they occur at the beginning of a game and later. At the beginning of a game level ups should often happen for better engagement, but then it should slow down; otherwise, there would be a persistent surplus of resources.


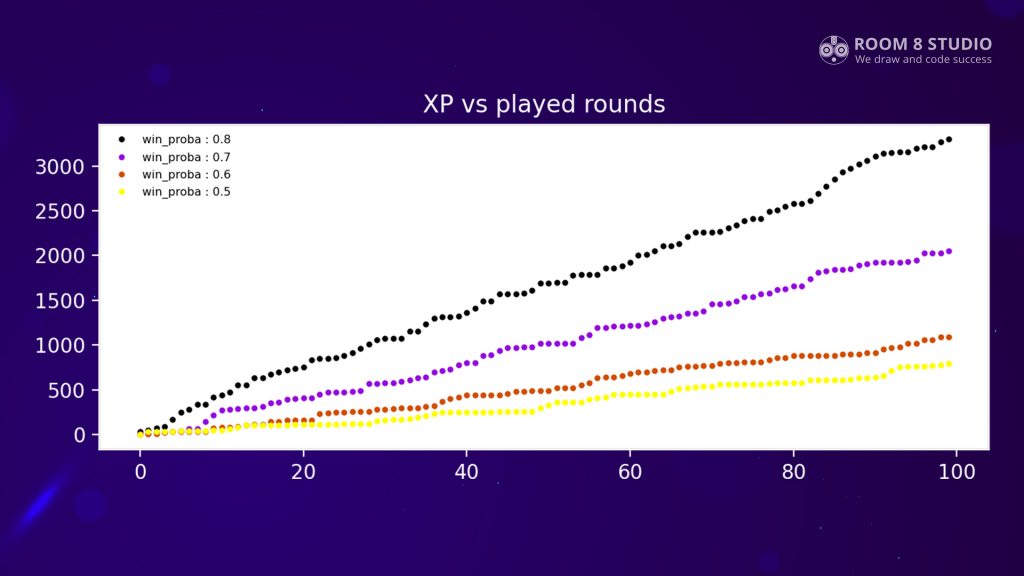
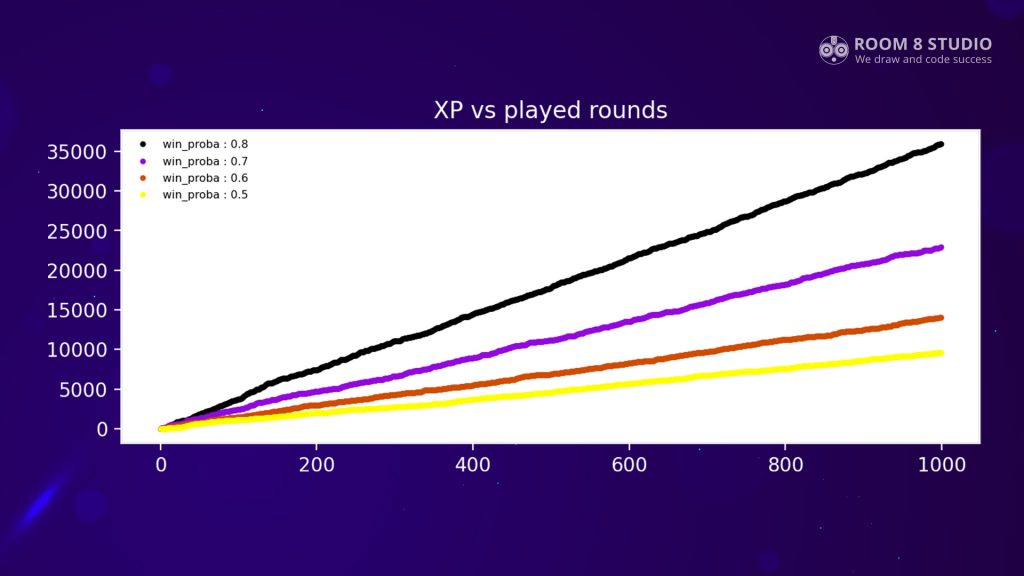
Figure 1 shows XP scores accumulation versus played rounds with eight questions in each, and rewards: +10 XP scores for a correct answer, +100 XP scores for a correct answer on the last question, modeled one time for players with different probabilities of winning.


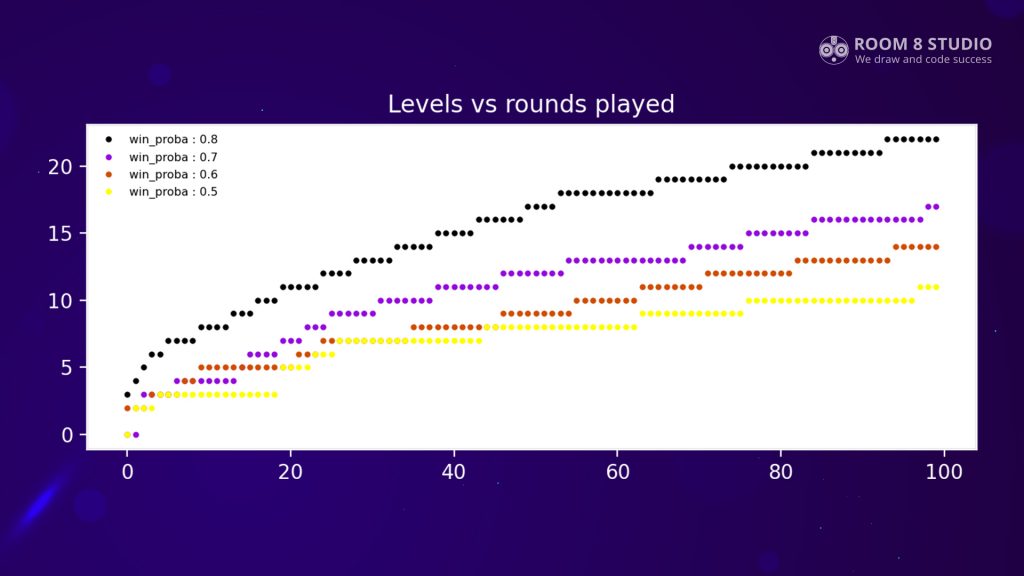
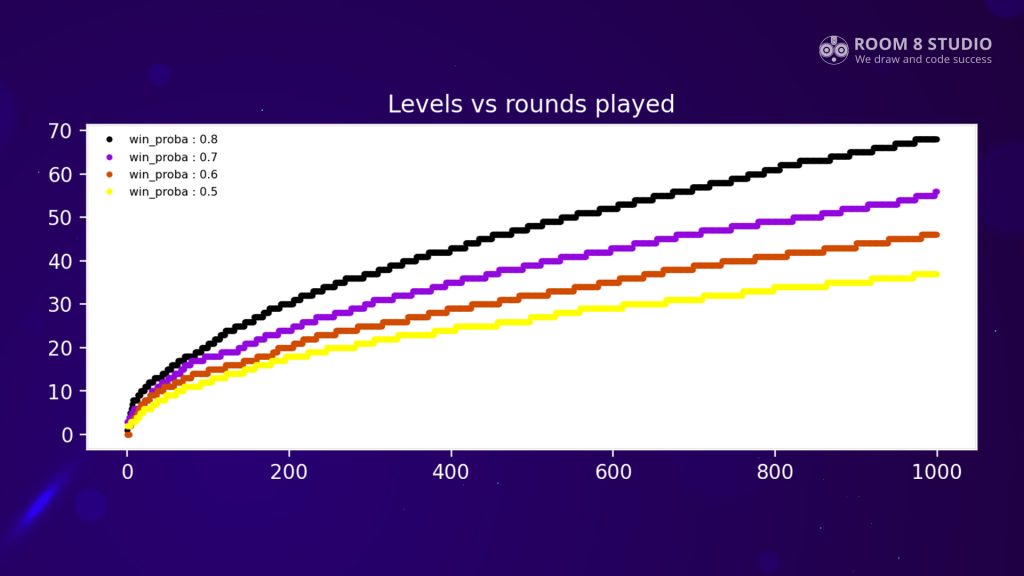
Figure 2 shows a reasonable level of progression for those players. They experience level-ups in the first 3-5 rounds, then progression goes faster, and they reach 7-15 levels at 30-60 rounds (when they expected to reach the last question according to estimations in the previous section). Then progression grows less rapidly, and level-ups occur each 10th round on an excellent playing person and each 20th round for a bad playing person.
Our Experience
Balancing the game economy can seem daunting even for the most experienced game designers. However, there are rules, guidelines, and models you can adhere to that can help you get the best out of your game and indeed get started. If you don’t have the skillset on your team to model the game economy, the task can be easily outsourced.
Room 8 Studio team provides game economy support to clients on an ongoing or project basis.
More about the level and economy design:
Case study: Trivia Royale Game Development Collaboration
Case study: Meow Match Level & Economy Design
Article: 5 Basic Steps in Creating Balanced In-Game Economy
Article: Smart & Casual: The State Of Tile Puzzle Games Level Design
Final Thoughts
In the example of a simple trivia game above, we designed two currency sources and modeled a progression through the game for players with different probabilities of winning. We saw how often both sources occur for a better-playing person and a worse-playing person.
In the next steps of designing and balancing sinks of resources, monetization strategy, and feeding content to the player, we should consider these estimations to view derived progression curves and frequencies of getting rewards.
Building a game economy requires expertise and experience: if you need some, Room 8 Studio’s game design and game economy teams are always happy to help.
Have a project in mind? Let’s talk!


